Gantt Charts
Dooster gives you easy to use, simple but highly effective gantts to help manage your time sensitive work
How It Works
At the Global level view, the Gantt chart simply displays the calculated start and end date for a project. This helps you to compare start and end dates for all your projects.
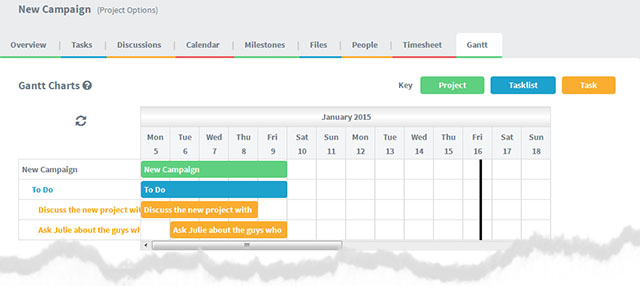
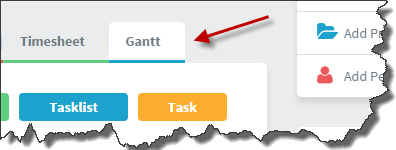
At the Project level view The Gantt displays the project, tasklist and task levels. (To get to the project level, click on the project in the global Gantt view or click on the Gantt tab when you are inside a project).

The project and tasklist levels calculate their start and end dates from the earliest start date and latest due date on the tasks it contains.
If no start date or due date exists at all in any of the tasks, then the bar will not show at all.
Please note: The task level only shows a bar for tasks which have both start AND due dates.
Checkout this quick video on Dooster Gantt charts
(Click here if you can’t see the video)
Related Keywords
Gannt, Gant, Gaant, Ganntt, Gantts, Gannts, Gants, Gaants
Questions?
 Visit our FORUM